Investigating factors affecting the severity of car crashes
Almost all of us drive every day. And we all face the danger of a car accident. Every day make a decision - should I drive to the destination via a highway or using local roads? Should I drive my child to school and let the school bus pick him/her up? Should I buy a sedan, SUV or coupe? Those decisions not only impact our convenience, but also our safety.
The goal is to investigate the factors which led to a car accident, including those, impacting the severity of injuries during the impact, as well as create a model to predict car crashes. The insights could be used by insurance agencies, car dealers, or just by people who are looking for a new, safer, car.
Dataset
I used Crash Report Sampling System (CRSS) data colelction, provided by The National Highway Traffic Safety Administration. It contains details about 101480 police-reported car accidents that happened in the US, including information about the vehicle, GPS coordinates, road conditions, weather, information about the car, driver, severity of injury received by passengers.
These crash reports are chosen from 60 selected areas across the United States that reflect the geography, population, miles driven, and crashes in the United States.

The severity of the injury for different vehicles
The first question I asked is what affects the severity of the injury received if the crash happens. Does it matter what type of car you are in?
Injury severity per body type
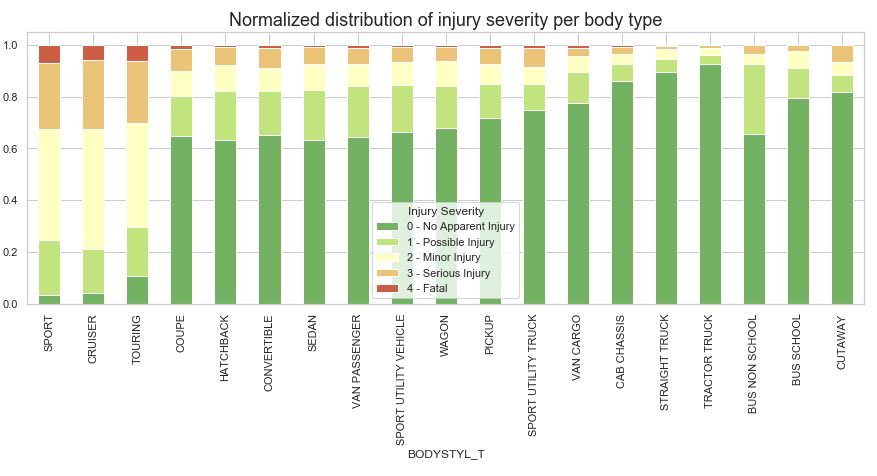
This plot shows the normalized distribution of injury severity per body type for accidents happened in 2016-2017 years.
Different vehicle body types strongly impact the severity of the injury if a crash happened.
For motorcycles, if a crash happened, there is almost no chance not to receive any injury, while for any car your chances are about 65-85%.
The safest are buses, followed by trucks. The weight of the vehicle matters a lot!
Coupes, as well as convertibles, shows a large fatality rate.
While the most popular car types - sedans and SUV shows visually similar distributions, the Chi-square test shows their independence (with very small p-value) - in other words, body type indeed affects injury severity:
def get_chi2_p(data, filters, column_name, aggregate_column="MAX_VSEV"):

    props = data.groupby(column_name)[aggregate_column].value_counts().unstack()

    chi2, p, dof, ex = stats.chi2_contingency(props[props.index.isin(filters)])

    return p

get_chi2_p(df, ["SEDAN", "SPORT UTILITY VEHICLE"], "BODYSTYL_T")

1.7742313124813528e-28
Injury severity per manufacturer
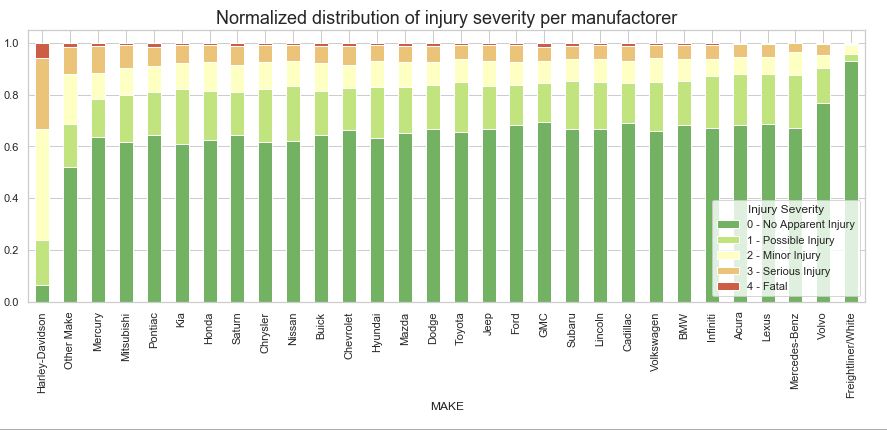
Do your chances to get insured, if a crash happens, depend on the manufacturer of the car you are in? Well, this plot shows that it does. Apart from a truck maker, Volvo is by far the safest car, followed by Mercedes, Lexus, Acura. Infinity and BMV. Mercury, Mitsubishi, Pontiac, and Kia among the least safe.
Now we know that choosing a luxury car is not only about comfort but also about safety. This information could be used by car dealers to promote certain safer brands.
Injury severity per year of manufacturing
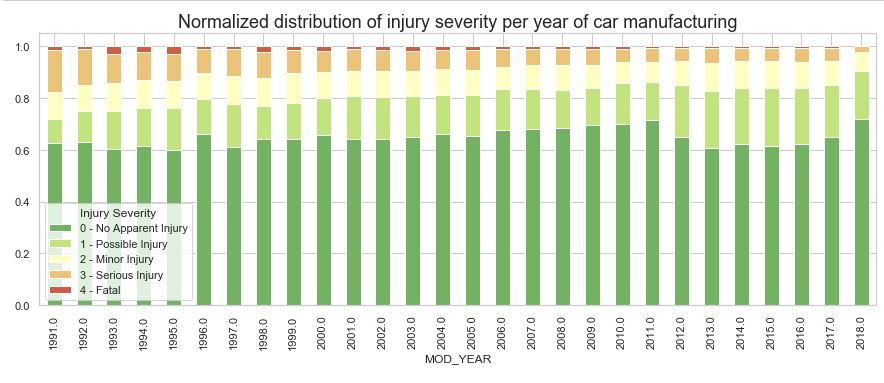
From this plot, we can see those modern cars provide much better protection for its riders against severe and fatal insures. But something happened right after the 2010 year - the percentage of passengers with no or minor injures dropped, while protection against fatal and severe injuries keep improving. So the question of whether to upgrade the car is not only about convenience but also about safety.
Factors that lead to an accident
Timing
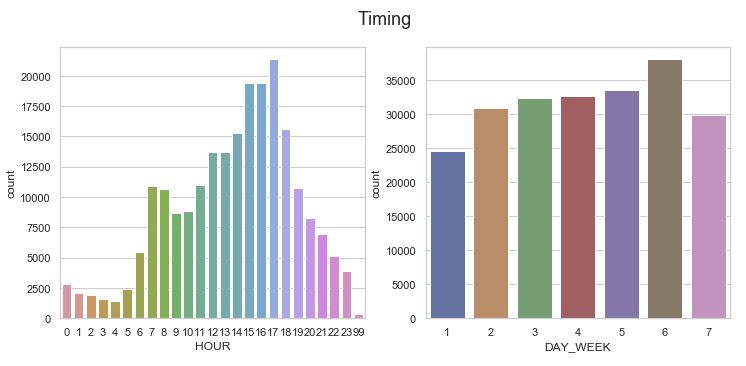
It seems that the more tired the drivers are, the more accidents happened. Afterwork hours are more dangerous than during the morning rush, and the furthest we are from the beginning of the workweek, the worse.
Alcohol
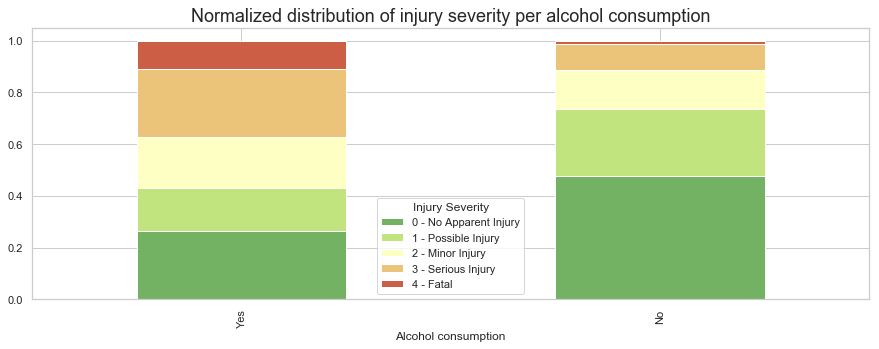
Crashes happened when on the drivers is under influence, are much more deadly than those without.
This statistic can be used to persuade people not to drive under alcohol influence. One thing is to know that it is dangerous, and others - know just how much dangerous it is.
Speeding
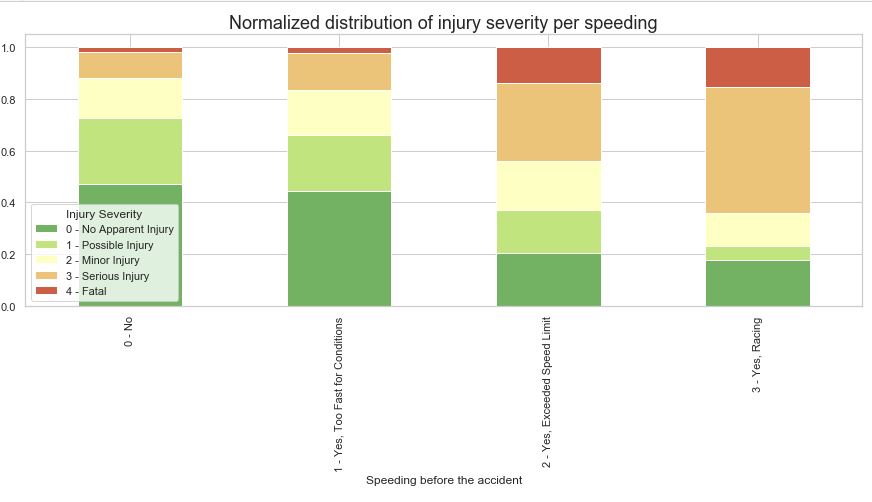
Same story with speeding. Chances to get killed or to kill someone during the crash when you’re speeding are 8 times larger than when you don’t!
Type of the road
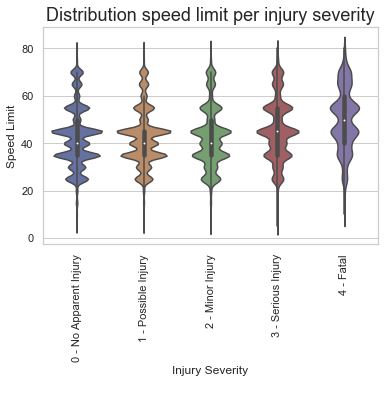
Accidents with severe injuries happen mostly on highways.
Maneuver to avoid accident
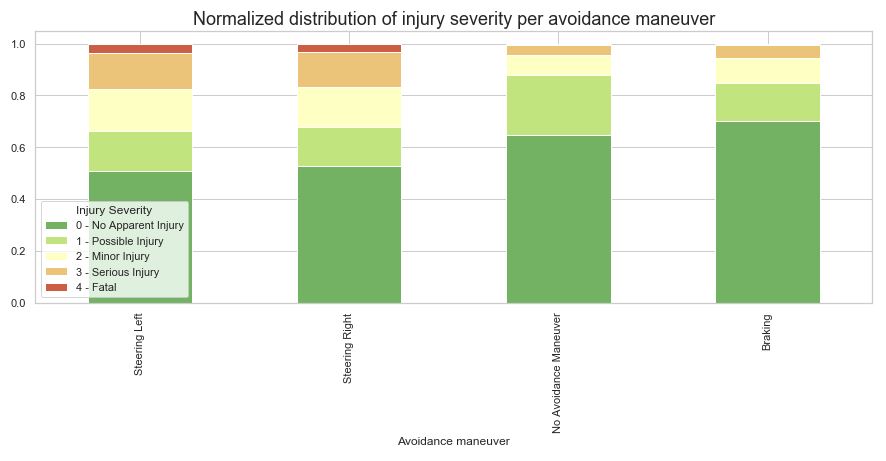
If you found yourself in a pre-accident situation, remember, that accidents happened when driver was trying to maneuver by steering more dangerous than those when you do nothing or just brake.
The chi-squared test below shows that the is no significant difference between steering left or right, but there is a strong difference between braking and steering left (right).
get_chi2_p(df, ["Steering Right", "Steering Left"], "P_CRASH3")

0.4356781892724938

get_chi2_p(df, ["Braking", "Steering Left"], "P_CRASH3")

4.4512624856085415e-136
Buckling up
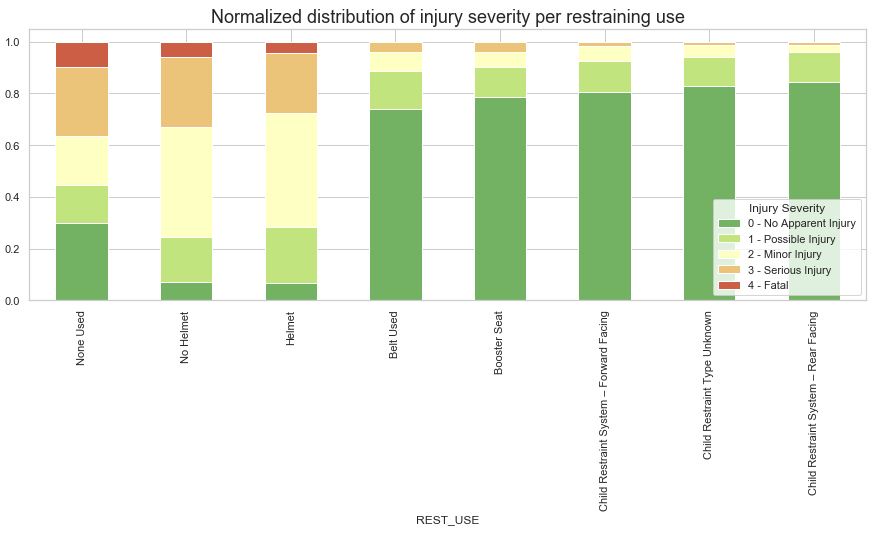
Remember that plots that show that motorcycles are unsafe? Well, driving inside the car without buckling up is even worse! In fact, your chances to get killed are 28 times larger when you are not buckled up! I personally know people who drive without a belt, you can even buy a belt fasteners placeholder on ebay, which will stop your car from beeping in protest. Educating people about the importance of the seat belt is very important.
Also, we can see that a rear-facing child seat is safer than front-facing.