
What affects our energy bills
We all pay our electric and gas bills, and there are factors that we can actually change in order to minimize our expenses. Knowing what and how influences our bills, we can make an informed decision on how to control our home’s parameters.
I set a goal to create a model that will predict the total cost of energy utilities, but in this post we’ll investigate the influence of different home attributes on it.
It can be useful to:
- homeowners thinking about home improvements or buying new appliances, answering the questions like “how much will I save if I insulate my attic”, or “should I really install smart thermostat”;
- contractors helping to persuade customers to renovation project;
- real estate brokers, helping make their customers more informed decisions by estimating heating and electric utilities cost.
Data Wrangling
The data is provided by U.S. Energy Information Administration in their residential energy consumption survey for the 2015 year.
According to RECS, this is a national sample survey that collects energy-related data for housing units occupied as a primary residence and the households that live in them. Data were collected from more than 5,600 households selected at random using a complex multistage, area-probability sample design. The sample represents 118.2 million U.S. households.
Data was read from .csv file. It has 759 columns and 5686 rows. It’s hard to get meaning from columns names with the abbreviation, and categorical variables encrypted with codes, values of which are stored in a separate file codebook_publicv4.xlsx.
Using the information provided in the additional file, I renamed columns according to their description and changed categorical variables codes to their values. Also, I converted columns containing categorical data to do type ‘category’. Some columns which don’t contain direct measures for our households, as well as columns containing somehow overlapping information, have been dropped.
The data has been split into predictive variables X and target variables, describing total energy consumption as a combination of different power sources (electricity, gas, oil), in BTU.
Missing values
Our data have no actual missing values, although it has a lot of ‘Not applicable’, like the type of pool heating system for houses without a pool.
For numerical variables, I replaced some numerical variables like the ones with temperature, with maximum or minimum of the column, while for most others just with 0.
For categorical variables, variables with “Yes”/”No” subset of values have been filled with “No”, some with default, and some with most common values.
All numerical variables have been normalized using sklearn’s StandardScaler (bringing them to mean of 0 and standard deviation of 1, and all categorical have been transformed to One Hot Encoding representation using pd.get_dummies method.
Cleaned data
After cleaning, our predictive variables looks like follows:
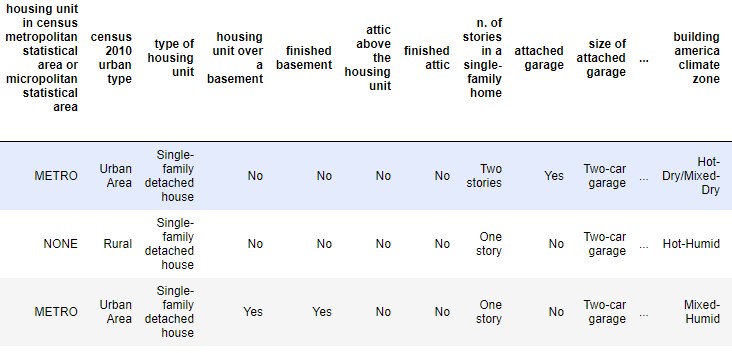
It has 5686 rows and 256 columns.
Exploratory Analysis
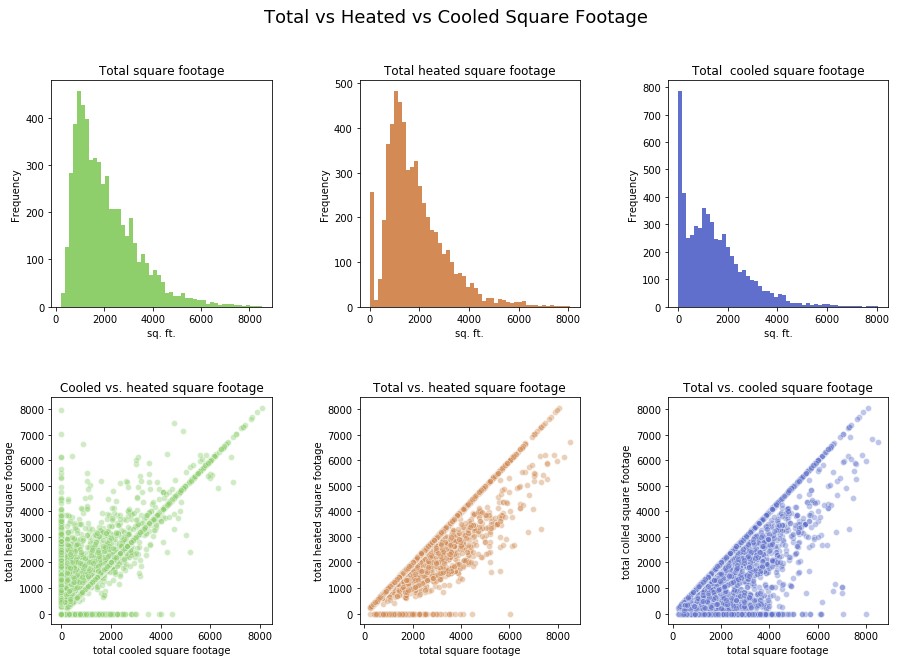
As one of the largest energy consumption factors of residential dwellings is heating/cooling, let’s take a look into square footage of the houses.
The mean size of the house is 2081 sq ft. The distribution of total square footage” is very right-skewed.
The average heated area is 1815 sq ft, also right-skewed. A lot of houses don’t have heating at all.
Average cooled area is much smaller - 1454 sq ft, much more houses don’t have cooling systems, or have it in only small parts of the homes.
Cooled vs. heated square footage plot shows that many houses have cooled areas the same as heating, but a lot of them have heated areas larger than cooling. A small fraction of households has a cooled area larger than heated.
Temperature in Winter
I was curious whether having a programmable or smart thermostat actually helps to lower the temperature when not needed.
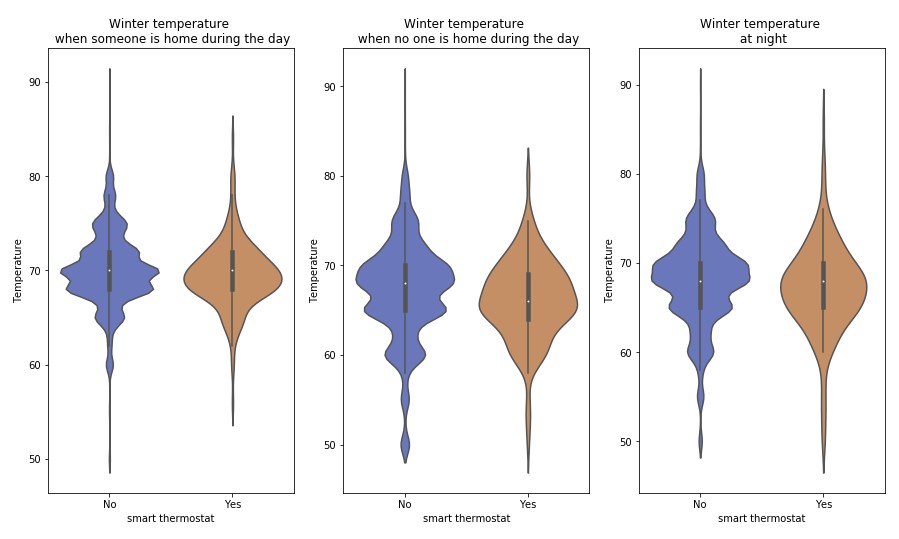
Distribution of temperatures for homes with smart thermostats look smoother than those without or with regular programmable ones, instead of uneven binomial distribution, we see almost perfect normal one.
Smother normal distribution makes households with smart thermostats easier to predict. 50% quantile for temperature when someone at home or at night quantile is the same for people with smart thermostats and without, while temperature when no one at home is noticeably lower.
If our goal is to minimize consumption, it would make sense to promote using a smart thermostat. Only a small fraction of people used it in 2015. Hopefully, this percentage has increased by 2019.
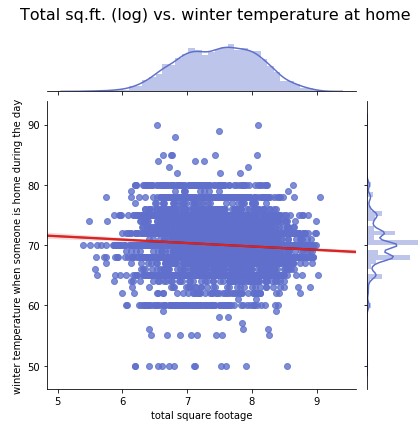
Also, the larger the home is, the harder it is to keep it warm. Winter temperature when someone is home during the day vs. total square footage plot shows that there is a negative trend:
Correlation heatmap
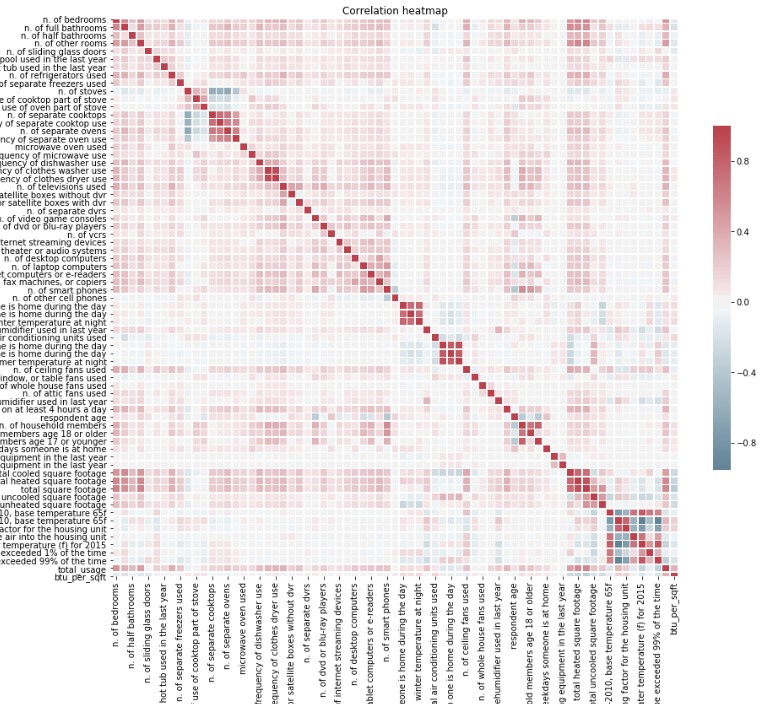
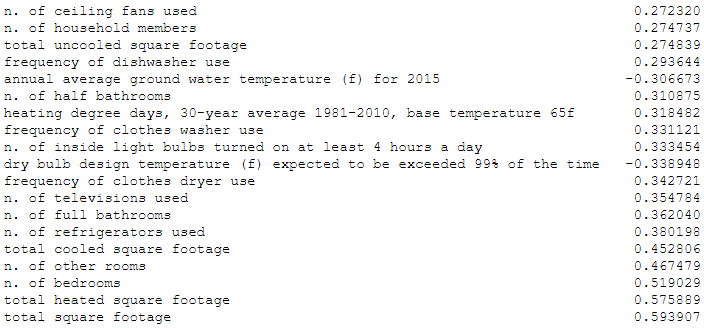
The size of the home is predictably the most important factor, so is the number of rooms, refrigerators used, the number of televisions used, frequency of clothes dryer use, a number of inside light bulbs turned on at least 4 hours a day. The correlation heatmap, as well as the top 20 variables with the highest correlation with the target variable, are shown below:
Total square footage vs. total energy usage
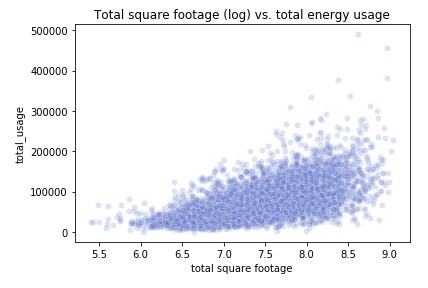
Plot Total square footage (log) vs. total energy usage shows that knowing the area of the home, we can easily predict upper bound - it’s a diagonal line, with no outliers beyond it. Total square footage is so powerful predictor variable, that in order to see the effect of some categorical variables (below), I added energy used by sq ft: *‘btu_per_sqft’ * variable.
Energy usage per sq. ft. vs. years when housing unit was built
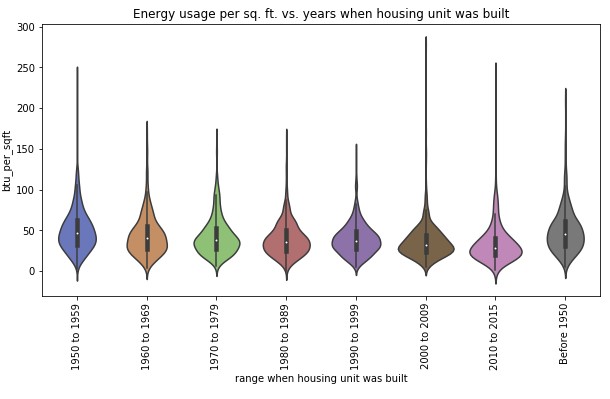
This plot shows a clear trend that newer houses are more energy efficient. This can serve as another reason to persuade the contractor’s client to build new construction, rather than renovate.
Energy usage per sq. ft. for housing unit types per own or rent
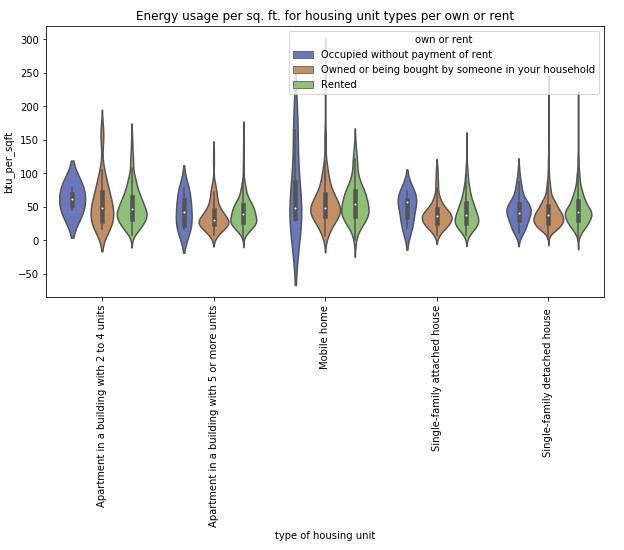
People who rent spend more per sq ft than whose who owns for every unit type, except for 2-4 units apartments. Those, knowing if the unit is owner or renter occupied, we can expect higher consumption. People who occupied without payment of rent spend so much more. Perhaps, they are not financially responsible for utilities as well, that’s why not eager to use thoughtfully. May be programs which will educate people about the environmental impact of wasteful use for such people could make a difference, if money can’t.
T-test below confirms that average consumption per sq ft, as well as total consumption for people who owns and who rents are different (significant p-value):
Ttest_indResult(statistic=-5.092762322269505, pvalue=3.740187974122832e-07)
Energy usage per sq. ft. vs. main space heating equipment type
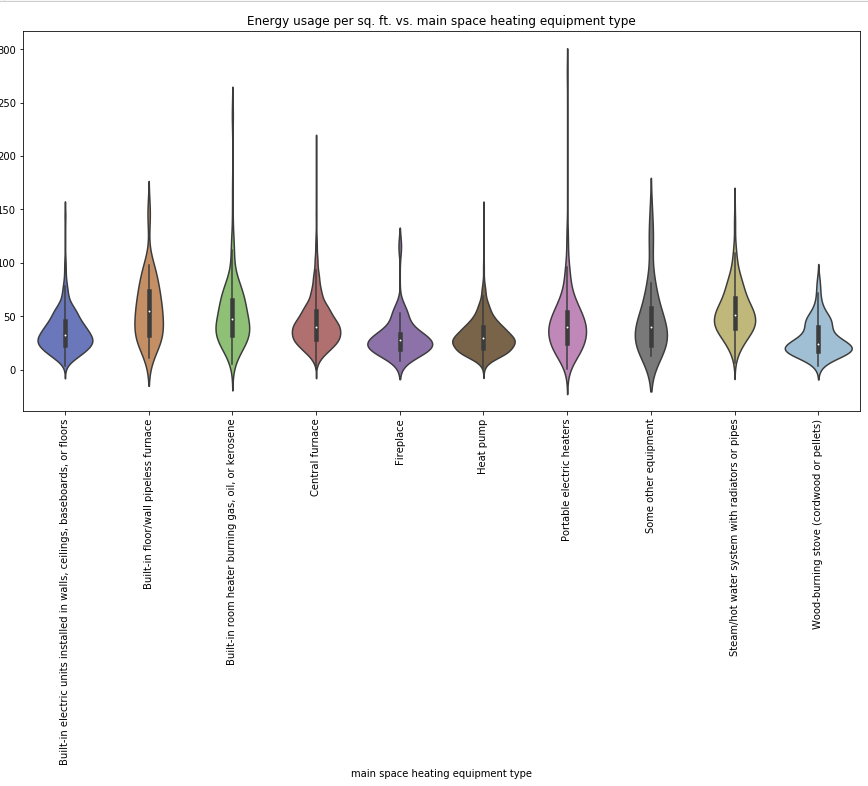
Energy usage per sq. ft. vs. main space heating equipment type plot basically shows the efficiency of heating equipment. For example, a steam/hot water system with radiators or pipes is visibly less effective than the central furnace, and both are outperformed by a heat pump.
For potential HVAC company, this can be valuable information to convince their customers to change the system to a heat pump.
Also, I tested the hypothesis that having or not having certain appliances in the home affects total consumption using the t-test. We have to reject the null hypothesis that having or not having clothes washer at the home has no effect on consumption. Same for clothes dryer, dishwasher, and even coffee maker.